Q1. The median of following observations, arranged in ascending order, is 25. Find x.
11, 13, 15, 19, x + 2, x + 4, 30, 35, 39, 46.
Solution
Here, n = 10
 Median = average of 5th and 6th observations
25 =
Median = average of 5th and 6th observations
25 =  25
25  2 = 2x + 6
50 - 6 = 2x
44 = 2x
Thus, x = 22
2 = 2x + 6
50 - 6 = 2x
44 = 2x
Thus, x = 22
25
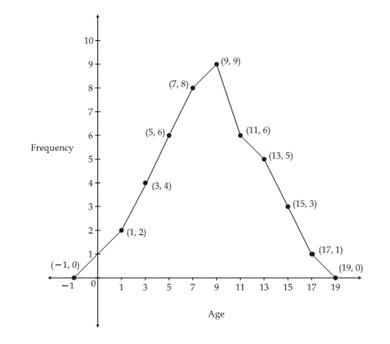
Q2. Construct a frequency polygon for the
following data:
Age
0 - 2
2 - 4
4 - 6
6 - 8
8 - 10
10 - 12
12 - 14
14 - 16
16 - 18
Frequency
2
4
6
8
9
6
5
3
1
Solution
First we obtain the class marks as
given in the following table.
Age
Class-mark
Frequency
0 -2
1
2
2 - 4
3
4
4 - 6
5
6
6 - 8
7
8
8 - 10
9
9
10 - 12
11
6
12 - 14
13
5
14 - 16
15
3
16 - 18
17
1
Now we plot the points on the
graph.
Q3. If the class marks in a frequency distribution are 19.5, 26.5, 33.5, 40.5 then the class corresponding to the class mark 33.5 is:
Solution
30 - 37 as 33.5 lies in between 30 and 37.
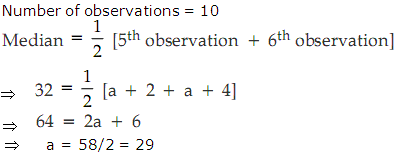
Q4. The median of the following observations
arranged in ascending order is 27. Find x.
13, 15, 17, 21, x + 2, x + 4, 32, 37, 41
and 48
Solution
Number
of observations = 10


 54 = 2x + 6
2x = 48
x = 24
54 = 2x + 6
2x = 48
x = 24
Q5. If the mean of 10, 12, 18, 11, p and 19 is 15, find the value of p.
Solution
Q6. Find the median of the following data
19, 25, 59, 48, 35, 37, 30, 32, 51.
If 25 is replaced by 52 what will be the new median?
Solution
Arranging data in ascending order, we have
19, 25, 30, 32, 35, 37, 48, 51, 59
So, n = 9
Thus, Median =  5th obs = 35
Now, if 25 is replaced by 52, we have
19, 30, 32, 35, 37, 48, 51, 52, 59
5th obs = 35
Now, if 25 is replaced by 52, we have
19, 30, 32, 35, 37, 48, 51, 52, 59
 Median = 37
5th obs = 35
Now, if 25 is replaced by 52, we have
19, 30, 32, 35, 37, 48, 51, 52, 59
Q7. Given below are the marks obtained by 50 students of class IX in a test of Hindi. 42, 21, 51, 37, 42, 37, 38, 42, 49, 52, 38, 53, 57, 47, 29, 59, 61, 33, 17, 71, 39, 43, 42, 39, 14, 7, 27, 19, 54, 51, 39, 43, 42, 16, 37, 67, 62, 39, 51, 53, 41, 53, 59, 37, 27, 33, 34, 42, 22, 31. With these data, form a less than type cumulative frequency table.(i) What is the range of marks. (ii) What can you conclude from the above data about the number of students who scored more than 35.
Solution
(i) Range of marks
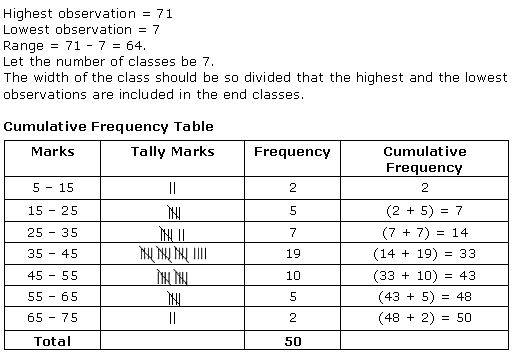 (ii) From cumulative frequency, we find that 14 students scored less than 35.
Thus, 50 - 14 = 36 students i.e. 72% students scored more than 35 marks.
(ii) From cumulative frequency, we find that 14 students scored less than 35.
Thus, 50 - 14 = 36 students i.e. 72% students scored more than 35 marks.
(ii) From cumulative frequency, we find that 14 students scored less than 35.
Thus, 50 - 14 = 36 students i.e. 72% students scored more than 35 marks.
Q8. The mean of 10 numbers is 55. If one number is excluded, their mean becomes 50, the excluded number is:
Solution
The sum of 10 numbers = 10  55 = 550
The sum of 9 numbers = 9 50 = 450
Therefore, excluded number = 550 - 450 = 100
55 = 550
The sum of 9 numbers = 9 50 = 450
Therefore, excluded number = 550 - 450 = 100
Q9. For what value of x, is the mode of the following data 17?15,16,17,13,17,16,14,x,17,16,15,15
Solution
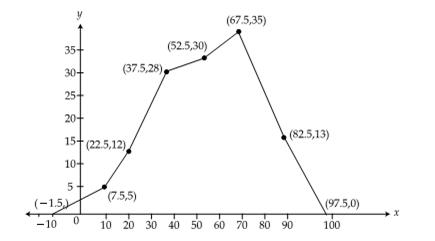
Q10. Following table gives the distribution of
the marks obtained by the students of a class.
Marks
0 - 15
15 - 30
30 - 45
45 - 60
60 - 75
75 - 90
Number of students
5
12
28
30
35
13
Represent the data by Frequency polygon.
Solution
Class
Class mark
Frequency
0 - 15
7.5
5
15 - 30
22.5
12
30 - 45
37.5
28
45 - 60
52.5
30
60 - 75
67.5
35
75 - 90
82.5
13
Q11. 
Solution
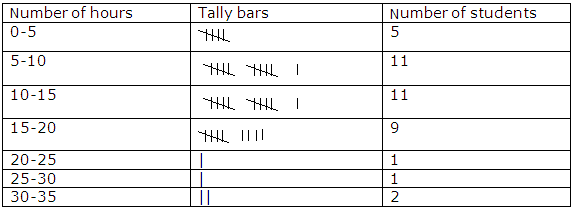 The number of students who practiced for over 20 hours are 1 + 1 + 2 = 4
Q12. Find the mean of first 10 prime numbers.
Solution
First 10 prime numbers are 2, 3, 5, 7, 11, 13, 17, 19, 23, 29
Sum = 129
n = 10

Q13. Median of the data 5, 9, 8, 6, 3, 5, 7, 12, 15 is
Solution
Arranging data in ascending order: 3, 5, 5, 6, 7, 8, 9, 12, 15
Number of observations = n = 9

Q14. For what value of y is the mode of the following data equal to 7? 3, 5, 6, 7, 3, 4, 7, 3, 6, y, 8, 7.
Solution
Q15. The relative humidity in Delhi, for the month of July, this year as reported by the Meteorological Department is given below : 90, 97, 92, 95, 93, 95, 93, 85, 83, 85, 83, 77, 83, 77, 74, 60, 71, 65, 80, 87, 82, 81, 76, 61, 63, 58, 58, 56, 57, 54, 98 Present the data in the form of frequency distribution.
Solution
Q16. If median of 29, 32, 48, 50, x, x + 2, 72, 78, 84, 95 (arranged in ascending order) is 63, find x.
Solution
Number of terms = 10 (even)
Median =  i.e. 63 =
 2x + 2 = 126
2x = 124
x = 62
2x + 2 = 126
2x = 124
x = 62
i.e. 63 =
Q17. The mean weight per student in a group of 7
students is 55 kg. The individual weights of 6 of them in kg are 52, 54, 55,
53, 56, 54. Find the weight of the seventh student.
Solution

Q18. 
Solution
Q19. 
Solution
Q20. Find the mean of factors of 24.
Solution
Factors of 24 are 1, 2, 3, 4, 6, 8, 12 and 24
Sum = 60
n = 8
Thus, Mean = 
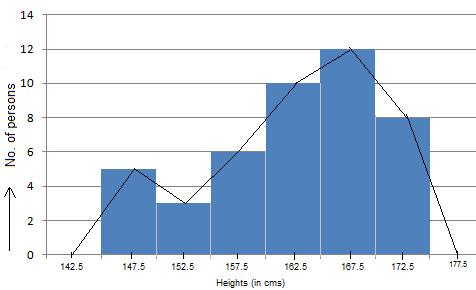
Q21. Find the mean of the following frequency distribution showing the marks obtained in a class test by 20 students.
Marks
10
15
20
25
No. of students
4
5
8
3
Solution
Marks (xi)
10
15
20
25
No. of students (fi)
4
5
8
3
fixi
40
75
160
75
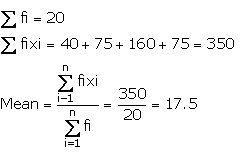
Q22. Draw a histogram for the following data:
Class interval
Frequency
10 - 14
300
15 - 19
980
20 - 24
800
25 - 29
600
30 - 34
300
35 - 39
430
40 - 44
530
Solution
Make intervals continuous.
Class interval
Frequency
9.5 - 14.5
300
14.5 - 19.5
980
19.5 - 24.5
800
24.5 - 29.5
600
29.5 - 34.5
300
34.5 - 39.5
430
39.5 - 44.5
530
The required histogram is as follows:
Q23. 
Solution
Q24. The class mark of class interval 60 - 70 will be
Solution
Class mark = 
Q25. If the mean of the following distribution is 6, find the value of p.
x
2
4
6
10
p + 5
f
3
2
3
1
2
Solution


Q26. Find the median of the following data:
15, 35, 18, 27, 19, 23, 29, 20, 28
Solution
Data can be arranged in ascending order as follows:
15, 18, 19, 20, 23, 27, 28, 29, 35
Here, n = 9 (odd)
Thus, Median = 
Q27.
Class Interval
Frequency
0 - 5
2
5 - 10
3
10 - 15
4
15 - 20
1
20 - 25
5
25 - 30
3
Make a frequency polygon for above given
frequency table.
Solution
Class Interval
Class Mark
Frequency
0 - 5
2.5
2
5 - 10
7.5
3
10 - 15
12.5
4
15 - 20
17.5
1
20 - 25
22.5
5
25 - 30
27.5
3
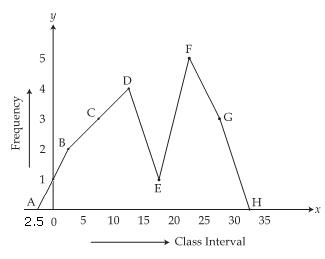 ABCDEFGH
is the frequency polygon.
ABCDEFGH
is the frequency polygon.
ABCDEFGH
is the frequency polygon.
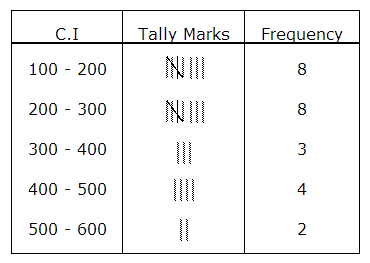
Q28. The marks obtained by 40 students of class IX in Mathematics are given below:
81, 55, 68, 79, 85, 43, 29, 68, 54, 73, 47, 35, 72, 64, 95, 44, 50, 77, 64, 35, 79, 52, 45, 54, 70, 83, 62, 64, 72, 92, 84, 76, 63, 43, 54, 38, 73, 68, 52, 54
Prepare a grouped continuous frequency distribution table with class-size of 10 marks.
Solution
Lowest = 29, Highest = 95
Marks
Tally
Frequency
20-30
|
1
30-40
|||
3
40-50
 5
50-60
|||
8
60-70
|||
8
70-80
||||
9
80-90
||||
4
90-100
||
2
5
50-60
|||
8
60-70
|||
8
70-80
||||
9
80-90
||||
4
90-100
||
2
Q29. The range of the data 25.7, 16.3, 2.8, 21.7, 24.3, 22.7, 24.9 is:
Solution
Range = Maximum value - Minimum value = 25.7 - 2.8 = 22.9
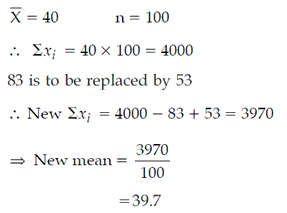
Q30. Mean of 25 observations was found to be 78.4. But later on, it was discovered that one observation 96 was misread as 69. Find the correct mean.
Solution
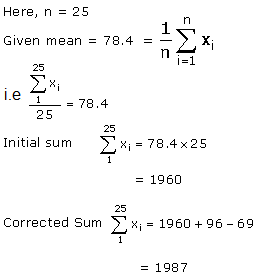 Corrected Mean =
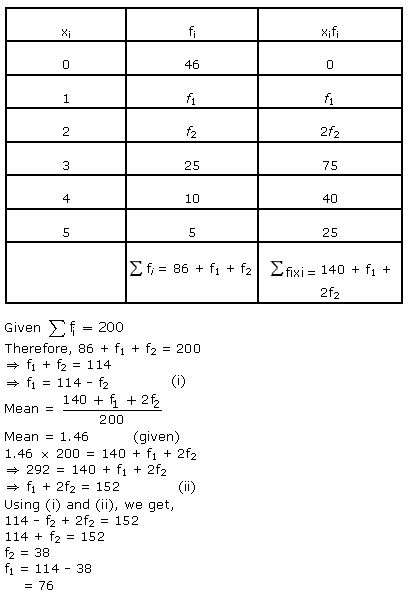
Q31. Find the missing frequencies f1 and f2 in the following frequency distribution, if it is known that the mean of the distribution is 1.46
x1
0
1
2
3
4
5
Total
f1
46
f1
f2
25
10
5
200
Solution
xi
fi
fixi
0
46
0
1
f1
f1
2
f2
2f2
3
25
75
4
10
40
5
5
25
 N = 86 + f1 + f2
We have N = 200
N = 86 + f1 + f2
We have N = 200
 200 = 86 + f1 + f2
 Thus, f1 = 114 - f2 .....(i)
Mean = 1.46
Thus, f1 = 114 - f2 .....(i)
Mean = 1.46
 292 = 140 + f1 + 2f2
 f1 + 2f2 = 152 .....(ii)
Solving (i) and (ii), we get
114 - f2 + 2f2 = 152
Thus, f2 = 38
Hence, f1 = 114 - 38 = 76
f1 + 2f2 = 152 .....(ii)
Solving (i) and (ii), we get
114 - f2 + 2f2 = 152
Thus, f2 = 38
Hence, f1 = 114 - 38 = 76
Q32. The mean of prime numbers between 20 and 30 is:
Solution
The only two prime numbers between 20 and 30 are 23 and 29.
 = 26
= 26
Q33. 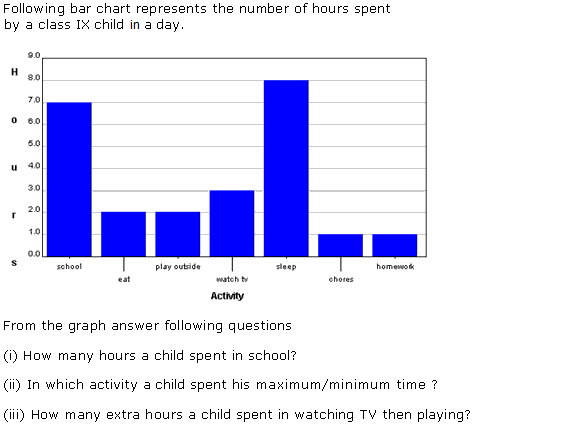
Solution
(i) A child spent 7 hours in a school. (ii) A child spent his maximum time (8 hours) in sleeping and minimum time (1 hour) in chores and homework. (iii) Time spent by a child in watching TV = 3 hours and time spent in playing is 2 hours. So, a child spent 3 - 2 = 1 hour extra in watching tv.
Q34. The mean of 25 observations is 36. If the
mean of the first 13 observations is 32 and that of last 13 observations is
39. Find the 13th observation.
Solution
Sum
of first 13 observations = 13  32 = 416
Sum
of last 13 observations = 13 39 = 507
Sum
of all 25 observations = 25 36 = 900
32 = 416
Sum
of last 13 observations = 13 39 = 507
Sum
of all 25 observations = 25 36 = 900
 The 13th observation = 416 + 507 -
900 = 23
13th observation = 23
The 13th observation = 416 + 507 -
900 = 23
13th observation = 23
Q35. The following observations have been arranged in ascending order:
29, 32, 48, 58, x, x + 2, 64, 78, 84, 90.
If median of the data is 63, find the mode of the data.
Solution
29, 32, 48, 58, x, x + 2, 64, 78, 84, 90.

 126 = 2x + 2
2x = 124
x = 62
126 = 2x + 2
2x = 124
x = 62
 observations are
29, 32, 48, 58, 62, 64, 64, 78, 84 90
As highest frequency = 2(Since 64 occurs 2 times)
Mode = 64
observations are
29, 32, 48, 58, 62, 64, 64, 78, 84 90
As highest frequency = 2(Since 64 occurs 2 times)
Mode = 64
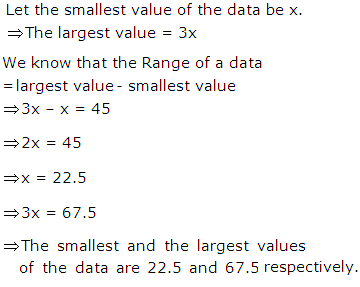
Q36. The range of a data is 45. The maximum value in the data is thrice the minimum value. So what are the minimum and maximum values in the data?
Solution
Q37. 
Solution
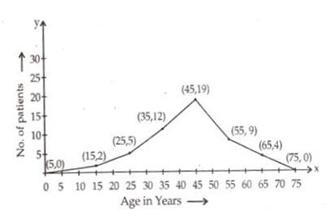
Q38. In
a study of diabetic patients in a village, the following observations were
noted.
Age
in years
10-20
20-30
30-40
40-50
50-60
60-70
Number
of patients
2
5
12
19
9
4
Represent
the above data by a frequency polygon.
Solution
The frequency distribution table with class
marks is given below:
Class-
intervals
Class
marks
Frequency
0-10
10-20
20-30
30-40
40-50
50-60
60-70
70-80
5
15
25
35
45
55
65
75
0
2
5
12
19
9
4
0
Plot
points (5,0), (15,2)………(65, 4) and (75, 0) to get the frequency polygon as
follows:
Q39. 
Solution
Q40. The mean of the following distribution is 50.
xi
10
30
50
70
90
fi
17
5a + 3
32
7a - 11
19
Find the value of a.
Solution
xi
10
30
50
70
90
fi
17
5a + 3
32
7a - 11
19
fixi
170
150a+90
1600
490a-770
1710
Mean = 


Q41. The following are the runs made by 22 players in a one day cricket series played between India and Pakistan.
79, 28, 45, 99, 3, 46, 8, 0, 3, 7, 75, 24, 73, 122, 46, 27, 16, 7, 100, 3, 67, 53
Construct a frequency distribution table for the above data with equal class intervals, one of these being 0 - 20 (20 not included).
Solution
Frequency distribution table:
Class Interval
Tally
Frequency
0-20
 8
20-40
8
20-40
 3
40-60
3
40-60
 4
60-80
4
80-100
4
60-80
4
80-100
 1
100-120
1
120-140
1
Sum
22
1
100-120
1
120-140
1
Sum
22
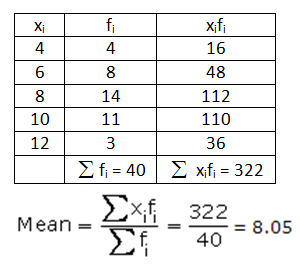
Q42. Obtain the mean of the following data:
Variable (xi)
4
6
8
10
12
Frequency (fi)
4
8
14
11
3
Solution
Q43. The blood groups of 30 students are recorded as follows : A, B, O, A, AB, O, A, O, B, A, O, B, A, AB, B, A, AB, B, A, A, O, A, AB, B, A, O, B, A, B, A Prepare a frequency distribution table for the data.
Solution
Q44. 
Solution
Q45. Find the median of the following data:
23, 31, 47, 46, 27, 37, 30, 24.
Solution
The data can be arranged in ascending order as
23, 24, 27, 30, 31, 37, 46, 47
Here n = 8 (even)
Median = Average of  and
and  observations
= Average of 4th and 5th observations
observations
= Average of 4th and 5th observations

and observations
= Average of 4th and 5th observations
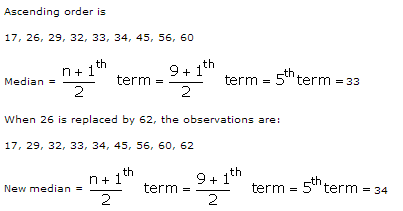
Q46. Find the median of the given data:
26, 56, 32, 33, 60, 17, 34, 29 and 45.
If 26 is replaced by 62, find the new median.
Solution
Q47. The points scored by a basket ball team in a series of match are as follows:
17, 2, 7, 27, 25, 5, 14, 18, 10, 24, 28, 10, 8, 7, 10, 28
Find the median and mode of the above data.
Solution
Arranging the data in ascending order, we get 2, 5, 7, 7, 8, 10, 10, 10, 14, 17, 18, 24, 25, 27, 28, 28
Since number of observations = 16, which is even
 Median is the mean of
  and
and  observations
 As 10 occurs most frequently i.e. 3 times, mode of the data is 10.
and observations
As 10 occurs most frequently i.e. 3 times, mode of the data is 10.
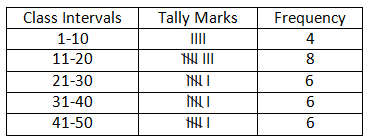
Q48. Following are the marks obtained by 30 students in an examination:
 Taking class intervals 1-10, 11-20, ... make a frequency table for the above distribution.
Taking class intervals 1-10, 11-20, ... make a frequency table for the above distribution.Solution
Frequency table is as follows:
Q49. Find mean, mode and median for the following data:
10, 15, 18, 10, 10, 20, 10, 20, 15, 21, 15 and 25
Solution
(i) Mea
(ii) Frequency of 10 is 4 which is maximum
 Mode = 10
(iii) Arrange the data in ascending order
10, 10, 10, 10, 15, 15, 15, 18, 20, 20, 21, 25
Here n = 12 (an even number)
Mode = 10
(iii) Arrange the data in ascending order
10, 10, 10, 10, 15, 15, 15, 18, 20, 20, 21, 25
Here n = 12 (an even number)


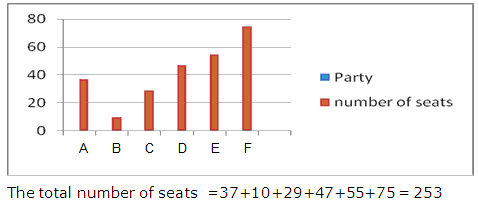
Q50. Given below are the seats won by different political parties in the following outcomes of state assembly elections.
Political party
A
B
C
D
E
F
Seats won
75
55
41
32
11
42
(i) Draw a bar graph to represent the polling results.
(ii) Which political party won the maximum number of seats?
Solution
(i) Bar graph:
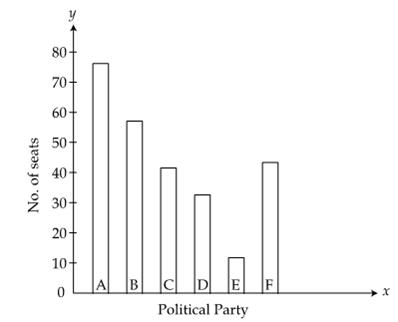 (ii) Party A won the maximum number of seats.
(ii) Party A won the maximum number of seats.
Q51. The electricity bills (in Rs.) of 25 houses in a certain locality are given below:
500, 440 ,100, 180, 150, 560, 300, 220, 300, 240,
150, 180, 120, 270, 420, 450, 250, 240, 200, 220,
140, 160, 250, 360, 470
Construct a grouped frequency table for this data with one of the class intervals as 100 - 200 (200 not included)
Solution
The frequency distribution table of the given data is as follows:
Q52. The following table gives the distribution of students of two sections according to the marks obtained by them.
Section A
Section B
Mark
Frequency
Marks
Frequency
0 - 10
2
0 - 10
5
10 - 20
12
10 - 20
11
20 - 30
18
20 - 30
15
30 - 40
13
30 - 40
12
40 - 50
5
40 - 50
7
Represent the marks of the students of both the sections on the same graph by two frequency polygons.
Solution
Section A
Section B
Marks
Class marks
Frequency
Marks
Class marks
Frequency
0 - 10
5
2
0 - 10
5
5
10 - 20
15
12
10 - 20
15
11
20 - 30
25
18
20 - 30
25
15
30 - 40
35
13
30 - 40
35
12
40 - 50
45
5
40 - 50
45
7
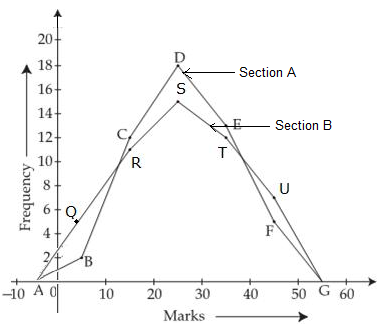 ABCDEFG is the frequency polygon for section A and AQRSTUG is the frequency polygon for section B.
ABCDEFG is the frequency polygon for section A and AQRSTUG is the frequency polygon for section B.
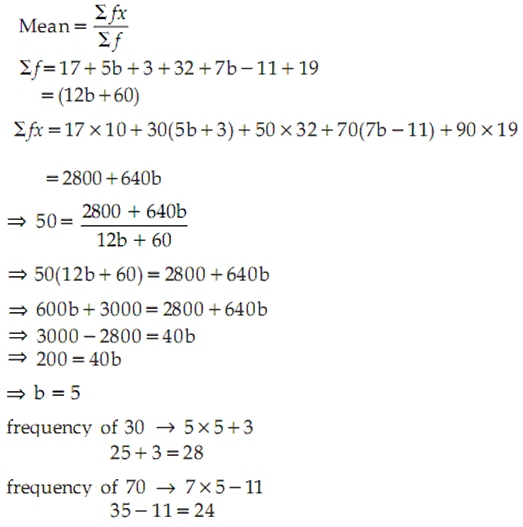
Q53. The mean of the following distribution is 50.
xi
10
30
50
70
90
yi
17
5p + 3
32
7p - 11
19
Find the value of p.
Solution
xi
fi
fixi
10
17
170
30
5p + 3
30(5p + 3)
50
32
1600
70
7p - 11
70 (7p - 11)
90
19
1710
Mean = 
 50(60 + 12p) = 2800 + 640p
3000 - 2800 = 640p - 600p
200 = 40p
Hence, p = 5
50(60 + 12p) = 2800 + 640p
3000 - 2800 = 640p - 600p
200 = 40p
Hence, p = 5
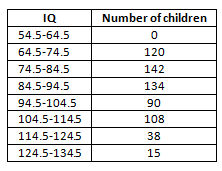
Q54. The following data shows IQs of some children. Represent it using the continuous frequency distribution.
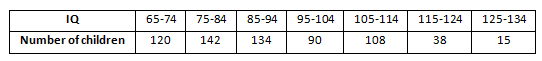
Solution
Making the class intervals continuous, we get
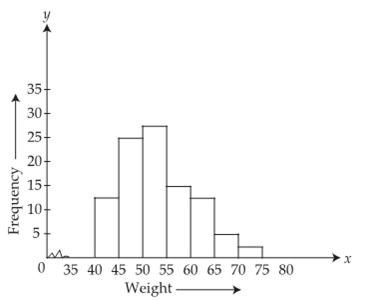
Q55. The distribution of weight (in kg) of 100
people is given below.
Weight in kg
Frequency
40
- 45
13
45
- 50
25
50
- 55
28
55
- 60
15
60
- 65
12
65
- 70
5
70
- 75
2
Construct a histogram for the above
distribution.
Solution
 Steps
of Construction:
(i) We
represent the weights on the horizontal axis. We choose the scale on
horizontal axis as 1 cm = 5 kg. Also, since the first class interval is
starting from 35 and not zero, we show
it on the graph by marking a kink or a break on the axis.
(ii) We represent
the number of people (frequency) on the vertical axis. Since the maximum
frequency is 28, we choose the scale as 1 cm = 5 people.
(iii) We
now draw rectangles (or rectangular bars) of width equal to the class-size
and lengths according to the frequencies of the corresponding class
intervals.
Steps
of Construction:
(i) We
represent the weights on the horizontal axis. We choose the scale on
horizontal axis as 1 cm = 5 kg. Also, since the first class interval is
starting from 35 and not zero, we show
it on the graph by marking a kink or a break on the axis.
(ii) We represent
the number of people (frequency) on the vertical axis. Since the maximum
frequency is 28, we choose the scale as 1 cm = 5 people.
(iii) We
now draw rectangles (or rectangular bars) of width equal to the class-size
and lengths according to the frequencies of the corresponding class
intervals.
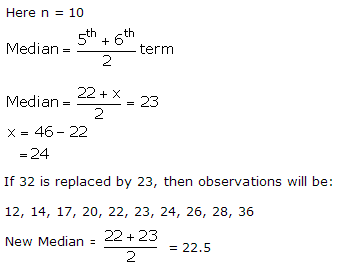
Q56. The following data has been arranged in ascending order:
12, 14, 17, 20, 22, x, 26, 28, 32, 36.
If the median of the data is 23, find x. In the above data, if 32 is replaced with 23, find the new median.
Solution
Q57. 
Solution
(i) Total exports = 1750 + 2000 + 1250 + 1750 = 6750 (All figures in lakhs) (ii) To Maldives, exports are below 1500 Lakhs. (iii) To Mayanmar, maximum goods are exported.
Q58. Find the mean of the first ten prime numbers.
Solution
The first ten prime numbers are
2, 3, 5, 7, 11, 13, 17, 19, 23, 29
Thus, Mean is given by


Q59. The value of  upto 50 decimal places is given below:
3.14159265358979323846264338327950288
(i) Make a frequency distribution of the digits from 0 to 9 after the decimal point.
(ii) What are the most and the least appearing digits?
upto 50 decimal places is given below:
3.14159265358979323846264338327950288
(i) Make a frequency distribution of the digits from 0 to 9 after the decimal point.
(ii) What are the most and the least appearing digits?
upto 50 decimal places is given below:
3.14159265358979323846264338327950288
(i) Make a frequency distribution of the digits from 0 to 9 after the decimal point.
(ii) What are the most and the least appearing digits?
Solution
Q60. 
Solution
Q61. The daily income of 50 doctors is given below:
Daily income (in Rs.)
No. of Doctors
0 - 1000
1000 - 2000
2000 - 3000
3000 - 4000
4000 - 5000
5000 - 6000
8
7
12
6
11
6
Draw a histogram for the above data.
Solution
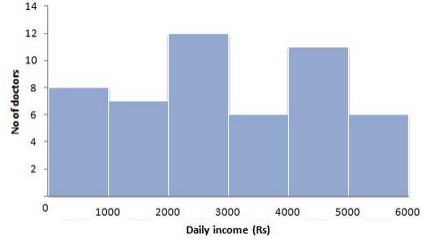 Steps of Construction:
(i) We represent the daily income on the horizontal axis. We choose the scale on horizontal axis as 1 cm = Rs. 1000.
(ii) We represent the number of doctors (frequency) on the vertical axis. Since the maximum frequency is 12, we choose the scale as 1 cm = 2 doctors.
(iii) We now draw rectangles (or rectangular bars) of width equal to the class-size and lengths according to the frequencies of the corresponding class intervals.
Steps of Construction:
(i) We represent the daily income on the horizontal axis. We choose the scale on horizontal axis as 1 cm = Rs. 1000.
(ii) We represent the number of doctors (frequency) on the vertical axis. Since the maximum frequency is 12, we choose the scale as 1 cm = 2 doctors.
(iii) We now draw rectangles (or rectangular bars) of width equal to the class-size and lengths according to the frequencies of the corresponding class intervals.
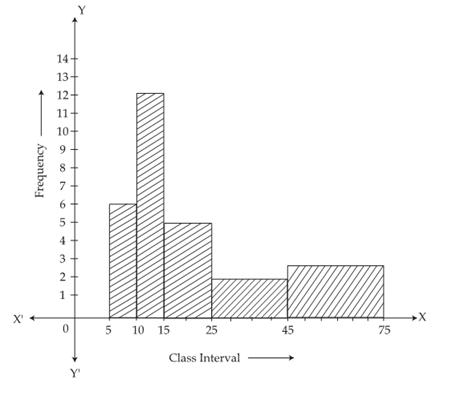
Q62. Draw histogram to represent the following
distribution.
Class Interval
5 - 10
10 - 15
15 - 25
25 - 45
45 - 75
Frequency
6
12
10
8
15
Solution
C.I
F
Width of the class
Adjusted Frequency
5 - 10
6
5
 10 -15
12
5
10 -15
12
5
 15 - 25
10
10
15 - 25
10
10
 25 - 45
8
20
25 - 45
8
20
 45 - 75
15
30
45 - 75
15
30

Q63. 
Solution
Q64. 
Solution
Comments
Post a Comment